Flexi MA Heat ZonesOverview
Flexi MA Heat Zones is a powerful multi-timeframe visualization tool that helps traders easily identify trend strength, direction, and potential zones of confluence using multiple moving averages and dynamic heatmaps. The indicator plots up to three pairs of customizable moving averages, with color-coded heat zones to highlight bullish and bearish conditions at a glance.
Whether you're a trend follower, mean-reversion trader, or looking for visual confirmation zones, this indicator is designed to offer deep insights with high customizability.
⚙️ Key Features
🔄 Supports multiple MA types: Choose from EMA, SMA, WMA, VWMA to suit your strategy.
🎯 Six moving averages: Three MA pairs (MA1-MA2, MA3-MA4, MA5-MA6), each with independent lengths and colors.
🌈 Heatmap Zones: Dynamic fills between MA pairs, changing color based on bullish or bearish alignment.
👁️🗨️ Full customization: Enable/disable any MA pair and its heatmap zone from the settings.
🪞 Transparency controls: Adjust the visibility of heat zones for clarity or stylistic preference.
🎨 Color-coded for clarity: Bullish and bearish colors for each heat zone pair, fully user-configurable.
🧩 Efficient layout: Smart use of grouped inputs for easier configuration and visibility management.
📈 How to Use
Use the MA1–MA2 and MA3–MA4 zones for longer-term trend tracking and confluence analysis.
Use the faster MA5–MA6 zone for short-term micro-trend identification or scalping.
When a faster MA is above the slower one within a pair, the fill turns bullish (user-defined color).
When the faster MA is below the slower one, the fill turns bearish.
Combine with price action or other indicators for entry/exit confirmation.
🧠 Pro Tips
For trend-following strategies, consider using EMA or WMA types.
For mean-reversion or support/resistance zones, SMA and VWMA may offer better zone clarity.
Overlay with RSI, MACD, or custom entry signals for higher confidence setups.
Use different heatmap transparencies to visually separate overlapping MA zones.
ค้นหาในสคริปต์สำหรับ "moving averages"

CCI Orbiting-VenusIndicator Description: CCI Orbiting-Venus
This is a customized version of the Commodity Channel Index (CCI) that measures the price deviation relative to its smoothed moving average to help identify overbought or oversold market conditions.
What does it do?
Calculates the CCI based on various price sources (such as close, open, high, low, and several price averages).
Applies customizable smoothing to the CCI using different types of moving averages (SMA, EMA, WMA, Hull, JMA, and SMMA).
Visually highlights the CCI direction with different colors:
Purple when CCI is above zero (positive momentum)
Orange when CCI is below zero (negative momentum)
Shows reference lines at +100 and -100 to help identify overbought and oversold zones.
How to use this indicator?
CCI Period Setting (CCI Period):
Adjust the number of periods used to calculate the CCI. Lower values make the indicator more sensitive, while higher values smooth out fluctuations.
Price Source (CCI Price Source):
Choose which price to base the calculation on: close, open, high, low, or weighted averages. This allows you to adapt the indicator to your trading style or strategy.
Smoothing Type (CCI Smoothing Type):
Select from different smoothing methods for the CCI calculation, which affects how the indicator behaves:
SMA (Simple Moving Average) – basic and traditional.
EMA, WMA, Hull, JMA (more advanced averages) – provide different noise filtering or faster response to price movements.
Interpreting CCI values:
Values above +100 suggest the asset may be overbought and could be near a downward reversal.
Values below -100 suggest the asset may be oversold and could be near an upward reversal.
Crossing the zero line indicates a potential change in trend or momentum.
Practical usage:
Look for buy signals when CCI moves up from the oversold region (-100) and crosses above zero, turning purple (positive).
Look for sell signals when CCI moves down from the overbought region (+100) and crosses below zero, turning orange (negative).
Combine with other indicators or chart analysis to confirm signals and avoid false entries.
Advantages of this custom indicator
Flexibility in choosing the price source and smoothing method.
Intuitive visual cues with colors indicating momentum direction.
Clear reference lines for quick assessment of extreme conditions.

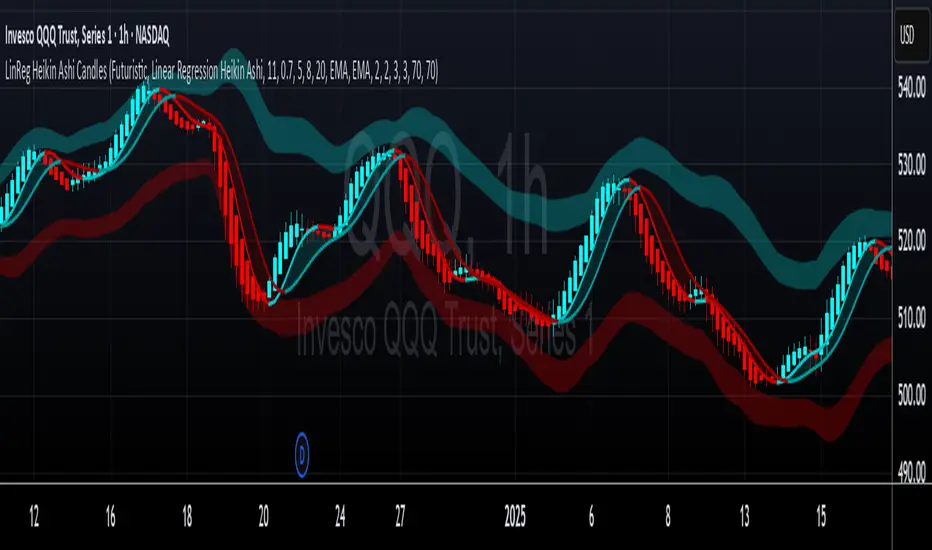
LinReg Heikin Ashi CandlesLinear Regression Heikin Ashi Candles will dramatically change how the candlesticks on your chart will appear. This script creates Heikin Ashi candles from the existing candlesticks and then applies wickless Linear Regression candles as an overlay. The result is an ultra smoothed 'Renko-like' chart that remains time-based and responsive.
Key Features:
Heikin Ashi Base: Provides a smoother representation of price trends by filtering out noise.
Linear Regression Candles on Heikin Ashi: Plots Linear Regression lines as candles on the Heikin Ashi chart, potentially highlighting the immediate trend direction and momentum within the smoothed data. Wicks are intentionally removed for a clearer focus on the linear progression.
Tillson T3 Moving Averages: Includes fast and slow T3 Moving Averages with customizable length and alpha. These smoothed moving averages can help identify trend direction and potential crossover signals. Users can toggle their visibility.
Volatility Bands: Integrates Volatility Bands based on Average True Range (ATR) with customizable length, ATR type (RMA, SMA, EMA, WMA), and inner/outer multipliers. These bands help gauge price volatility and potential reversal zones. Users can toggle the visibility of the basis line.
Customizable Colors: Allows users to customize the colors of the Linear Regression Heikin Ashi bullish and bearish candles.
How to Use:
This is an overlay on your chart so you'll need to 'hide' the existing candlesticks on your chart.
This indicator can be used on any timeframe from seconds to days to quickly identify market trend, gauge volatility, and potentially find entry/exit points. Consider looking for confluence between the candle color/direction, T3 MA crossovers, and price interaction with the Volatility Bands.
Note: This indicator plots Linear Regression directly on Heikin Ashi candles, removing wicks for a focus on the linear trend within the smoothed data. Adjust the input parameters to suit your trading style and the specific market conditions.
HUGE CREDIT to ugurvu who originally created the Linear Regression Candles indicator that my indicator pulls code from.
Power of MovingThe Power of Moving indicator is a multi-moving average indicator designed to help traders identify strong trending conditions by analyzing the alignment and separation of multiple moving averages.
This indicator allows users to select between different types of moving averages (SMA, EMA, SMMA, WMA, VWMA) and plots four configurable moving averages on the chart. The background color dynamically changes when the moving averages are correctly stacked in a bullish (green) or bearish (yellow) formation, with sufficient distance between them. This ensures that trends are not only aligned but also have strong momentum. The indicator also includes alert conditions, notifying traders when the trend direction changes, allowing them to stay ahead of market moves.
This indicator works well in trending markets and should be combined with price action analysis or other confirmation indicators like RSI or volume for optimal results.

IB & Hammer at SMA(20,50|200)IB & Hammer at SMA (20, 50, 200) Breakout/Breakdown Indicator
Overview:
The IB (Inside Bar) & Hammer at SMA Breakout/Breakdown Indicator is designed to identify breakout and breakdown opportunities using Inside Bars (IB) in combination with Simple Moving Averages (SMA 20, 50, 200) as key trend filters. This indicator is useful for traders looking to catch momentum moves after consolidation phases, confirming the trend direction with moving averages.
Indicator Logic:
Inside Bar (IB) Detection:
An Inside Bar is a candlestick that is completely within the range of the previous candle (i.e., lower high and higher low).
Inside Bars indicate consolidation, suggesting a potential breakout.
SMA Trend Confirmation:
The script uses three moving averages (SMA 20, 50, 200) to determine the trend direction.
Bullish trend: Price is above the 50 & 200 SMAs.
Bearish trend: Price is below the 50 & 200 SMAs.
The 20 SMA is used as a dynamic short-term momentum filter.
Breakout & Breakdown Conditions:
Breakout: When price breaks above the Inside Bar’s high, and the trend is bullish (above key SMAs).
Breakdown: When price breaks below the Inside Bar’s low, and the trend is bearish (below key SMAs).
Alerts can be set to notify traders of potential trade opportunities.
Features:
✅ Identifies Inside Bars (consolidation zones).
✅ Uses SMA (20, 50, 200) for trend confirmation.
✅ Breakout/Breakdown signals based on Inside Bar structure.
✅ Customizable Moving Averages & Alerts.
✅ Visual markers for easy trade identification.
How to Use:
Confirm Trend Direction:
If the price is above SMA 50 & 200, look for breakout trades.
If the price is below SMA 50 & 200, look for breakdown trades.
Watch for Inside Bars:
The script highlights Inside Bars with a specific color (configurable).
These bars indicate a low-volatility phase, preparing for a breakout.
Trade on Breakout/Breakdown:
Breakout: Enter long when the price breaks above the Inside Bar’s high (bullish trend).
Breakdown: Enter short when the price breaks below the Inside Bar’s low (bearish trend).

EMA/SMA + Multi-Timeframe Dashboard (Vertical)20/50 ema and 200 sma
The EMA SMA Trading Indicator combines the power of Exponential Moving Averages (EMA) and Simple Moving Averages (SMA) to help traders identify trends, reversals, and key entry/exit points.
Features:
Dual Moving Averages: Tracks both EMA and SMA to provide a balanced view of short-term and long-term market trends.
Customizable Periods: Allows users to set unique periods for EMA and SMA to suit their trading style and timeframe (e.g., day trading, swing trading, or investing).
Cross Alerts: Highlights EMA and SMA crossover points, which often indicate potential buy or sell signals.
Color-Coded Lines: Visual differentiation between EMA (dynamic and responsive) and SMA (smooth and lagging) for better readability.
Multi-Timeframe Compatibility: Suitable for scalping, intraday trading, and long-term analysis.
Usage:
Trend Confirmation: When the EMA is above the SMA, it signals a bullish trend; when it is below the SMA, it signals a bearish trend.
Crossover Strategy: Use crossovers as potential buy (EMA crosses above SMA) or sell (EMA crosses below SMA) signals.
Dynamic Support/Resistance: EMA can act as short-term support/resistance, while SMA represents long-term levels.
This indicator is perfect for traders who want to combine EMA's speed with SMA's stability for improved decision-making in volatile markets. Customizable alerts and visual cues make it user-friendly for beginners and experienced traders.
Make informed decisions and take your trading to the next level with the EMA SMA Trading Indicator!

IPO Lifecycle Sell Strategy [JARUTIR]IPO Lifecycle Sell Strategy with Dynamic Buy Date and Multiple Sell Rules
This custom TradingView script is designed for traders looking to capitalize on dynamic strategies for IPOs and growth stocks, by implementing several sell rules based on price action and technical indicators. It provides a set of sell rules that are applied dynamically depending on the stock's lifecycle and price action, allowing users to lock in profits and minimize drawdowns based on key technical thresholds.
The four sell strategies incorporated into this script are inspired by the book "The Lifecycle Trade", a resource that focuses on capturing profits while managing risk in different phases of a stock's lifecycle, from IPO to high-growth stages.
Key Features:
Buy Price and Buy Date: You can either manually input your buy price and date or let the script automatically detect the buy date based on the specified buy price.
Multiple Sell Strategies: Choose from 4 predefined sell strategies:
Ascender Rule : Captures strong momentum from IPO stocks by selling portions at specific price levels or technical conditions.
Midterm Rule : Focuses on holding for longer periods, with defensive sell signals triggered when the stock deviates significantly from peak price or key moving averages.
40 Week Rule : Designed for long-term holds, this rule triggers a sell when the stock closes below the 40-week moving average.
Everest Rule : Aggressive strategy for selling into strength based on parabolic moves or gap downs, ideal for high momentum stocks.
Interactive Features:
Horizontal Green Line showing the buy price level from the buy date.
Visual Sell Signals appear only after the buy date to ensure that your analysis is relevant to the stock lifecycle.
Customizable settings, allowing you to choose your preferred sell rule strategy and automate buy date detection.
This script is perfect for traders using a strategic, systematic approach to IPOs and high-growth stocks, whether you're looking for quick exits during momentum phases or holding for longer-term growth.
Usage:
Input your Buy Price and Buy Date, or allow the script to automate the buy date detection.
Select a Sell Rule strategy based on your risk profile and trading style.
View visual signals for selling when specific conditions are met.
Frequently Asked Questions (FAQs):
Q1: How do I input my Buy Price and Buy Date?
The script allows you to either manually input the Buy Price and Buy Date or use the automated detection. If you choose automated detection, the script will automatically assign the buy date when the price crosses above your set Buy Price.
Q2: What is the purpose of the "Sell Rules"?
The script offers four sell strategies to help manage different types of stocks in varying phases of their lifecycle:
Ascender Rule: Targets IPO stocks showing positive momentum.
Midterm Rule: A defensive strategy for stocks in a steady uptrend.
40 Week Rule: Long-term hold strategy designed to ride stocks through extended growth.
Everest Rule: Aggressive strategy to capture profits during parabolic price moves.
Q3: What is the significance of the Green Line at Buy Price?
The Green Line represents your entry point (Buy Price) on the chart. It will appear from the buy date onwards, helping you track the performance of your stock relative to your entry.
Q4: Can I customize the Sell Strategy?
Yes! You can choose from the available Sell Rules (Ascender Rule, Midterm Rule, 40 Week Rule, Everest Rule) via an input option in the script. Each strategy has its own unique triggers based on price action, moving averages, and time-based conditions.
Q5: Does this script work for stocks and crypto?
Yes, this script is designed for both stocks and cryptocurrencies. It works on any asset where price data and timeframes are available.
Q6: How do the Weekly Moving Averages (WSMA) work in this strategy?
The script uses weekly moving averages (WSMA) to track longer-term trends. These are essential for some of the sell rules, such as the Midterm Rule and 40 Week Rule, which rely on the stock's movement relative to the 40-week moving average.
Q7: Will the script plot a Sell Signal immediately after the Buy Date?
No, sell signals will only be plotted after the Buy Date. This ensures that the sell strategy is relevant to your actual holding period and avoids premature triggers.
Q8: How do I interpret the Sell Signal?
The script will plot a Red Sell Signal above the bar when the sell conditions are met, based on the selected strategy. This indicates that it may be a good time to exit the position according to your chosen rule.
Q9: Can I use this strategy on different timeframes?
Yes, you can apply the script to any timeframe. However, some sell strategies, like the Midterm Rule and 40 Week Rule, are designed to work best with weekly data, so it's recommended to use these strategies with longer timeframes.
Q10: Does this script have any alerts?
Yes! The script supports alert conditions that will notify you when the sell conditions are met according to your selected rule. You can set up alerts to stay informed without needing to watch the chart constantly.
Q11: What if I want to disable some of the sell rules?
You can select your preferred sell rule using the "Select Sell Rule" dropdown. If you don’t want to use a particular rule, simply choose a different strategy or leave it inactive.
------------------------------
Disclaimer:
This strategy is intended for educational purposes only. It should not be considered financial advice. Always perform your own research and consult with a professional before making any trading decisions. Trading involves significant risk, and you should never trade with money you cannot afford to lose.

True Range Trend StrengthThis script is designed to analyze trend strength using True Range calculations alongside Donchian Channels and smoothed moving averages. It provides a dynamic way to interpret market momentum, trend reversals, and anticipate potential entry points for trades.
Key Functionalities:
Trend Strength Oscillator:
Calculates trend strength based on the difference between long and short momentum derived from ATR (Average True Range) adjusted stop levels.
Smooths the trend strength using a simple moving average for better readability.
Donchian Channels on Trend Strength Oscillator:
Plots upper and lower Donchian Channels on the smoothed trend strength oscillator.
Traders can use these levels to anticipate breakout points and determine the strength of a trend.
Zero-Cross Shading:
Highlights bullish and bearish zones with shaded backgrounds:
Green for bullish zones where smoothed trend strength is above zero.
Red for bearish zones where smoothed trend strength is below zero.
Moving Averages for Oscillator:
Overlays fast and slow moving averages on the oscillator to provide crossover signals:
Fast MA Cross Above Slow MA: Indicates bullish momentum.
Fast MA Cross Below Slow MA: Indicates bearish momentum.
Alerts:
Alerts are available for MA crossovers, allowing traders to receive timely notifications about potential trend reversals or continuation signals.
Anticipating Entries with Donchian Channels:
The integration of Donchian Channels offers an edge in anticipating excellent trade entries.
Traders can use the oscillator's position relative to the channels to gauge oversold/overbought conditions or potential breakouts.
Use Case:
This script is particularly useful for traders looking to:
Identify the strength and direction of market trends.
Time entries and exits based on dynamic Donchian Channel levels and trend strength analysis.
Incorporate moving averages and visual cues for better decision-making.

Price Movement Predictor (PMP)The Price Movement Predictor (PMP) is a versatile trading indicator designed to assist traders in identifying potential buy and sell opportunities in the market. This indicator utilizes a combination of technical analysis tools to generate signals based on the relative strength index (RSI) and moving averages, ensuring a robust and strategic approach to trading.
Key Features:
RSI-Based Signal Generation:
The indicator monitors the RSI to identify overbought and oversold conditions in the market.
A buy signal is generated when the RSI drops below a predefined oversold threshold, indicating potential upward price movement.
Conversely, a sell signal is triggered when the RSI exceeds a specified overbought level, suggesting a possible price decline.
Moving Average Confirmation:
The indicator employs two moving averages: a short-term and a long-term moving average.
Buy and sell signals are confirmed only after a crossover event occurs, ensuring that trades are entered in alignment with market trends.
The short moving average crossing above the long moving average confirms a buy signal, while a crossover below confirms a sell signal.
Take Profit and Stop Loss Management:
The PMP includes adjustable take profit and stop loss levels, which are automatically calculated based on user-defined percentages.
Labels indicating the take profit (TP) and stop loss (SL) levels are plotted on the chart, helping traders manage their risk effectively.
Alerts are available for both TP and SL conditions, allowing traders to stay informed about their trade outcomes.
User-Friendly Interface:
The indicator provides an intuitive setup with adjustable parameters for moving average lengths, RSI levels, and TP/SL ratios.
Clear buy and sell signals are displayed directly on the chart, making it easy for traders to act on potential opportunities.
Usage:
The Price Movement Predictor is ideal for traders who seek a systematic approach to identify trading opportunities and manage risk. By combining RSI signals with moving average crossovers, the indicator helps filter out false signals and enhances the accuracy of trade entries. It is suitable for various trading styles, including day trading, swing trading, and long-term investing.

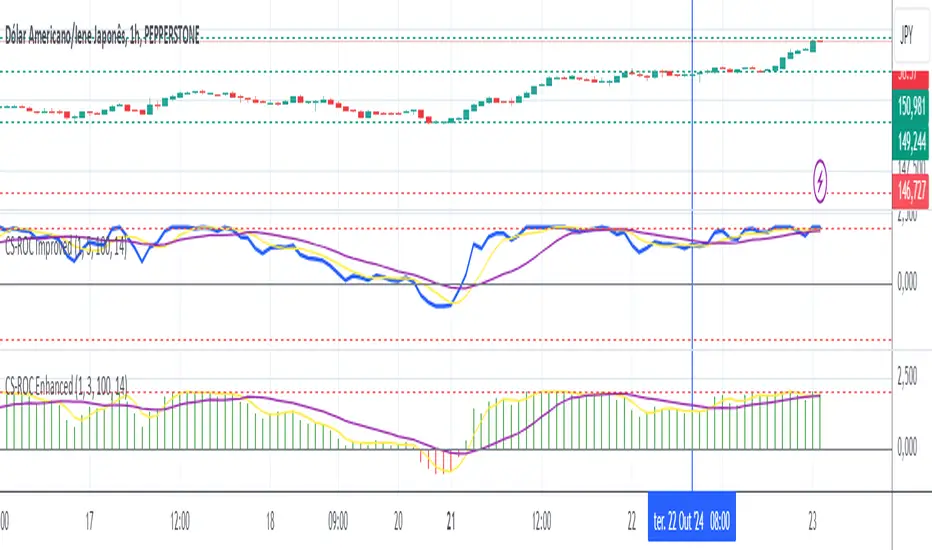
MB - Currency Strength ROCCurrency Strength ROC Enhanced is a technical indicator designed to measure and visualize the relative strength of different currencies in the foreign exchange market. Using a Rate of Change (ROC) approach and moving averages, this indicator provides valuable insights into the dynamics of currency strengths.
Key Features:
Relative Strength Measurement:
Calculates the strength of each currency relative to others, allowing you to identify which currencies are appreciating or depreciating.
Strength Histogram:
Presents normalized strength in a histogram format, making it easy to quickly see areas of positive (green) and negative (red) strength
Moving Averages:
Includes moving averages of normalized strength and trend, providing a clear view of the overall direction of strength over time.
Overbought and Oversold Zones:
Highlights critical levels of strength through horizontal lines, allowing traders to identify potential trend reversals.
Volumatic Variable Index Dynamic Average [BigBeluga]The Volumatic VIDYA (Variable Index Dynamic Average) indicator is a trend-following tool that calculates and visualizes both the current trend and the corresponding buy and sell pressure within each trend phase. Using the Variable Index Dynamic Average as the core smoothing technique, this indicator also plots volume levels of lows and highs based on market structure pivot points, providing traders with key insights into price and volume dynamics.
Additionally, it generates delta volume values to help traders evaluate buy-sell pressure balance during each trend, making it a powerful tool for understanding market sentiment shifts.
BTC:
TSLA:
🔵 IDEA
The Volumatic VIDYA indicator's core idea is to provide a dynamic, adaptive smoothing tool that identifies trends while simultaneously calculating the volume pressure behind them. The VIDYA line, based on the Variable Index Dynamic Average, adjusts according to the strength of the price movements, offering a more adaptive response to the market compared to standard moving averages.
By calculating and displaying the buy and sell volume pressure throughout each trend, the indicator provides traders with key insights into market participation. The horizontal lines drawn from the highs and lows of market structure pivots give additional clarity on support and resistance levels, backed by average volume at these points. This dual analysis of trend and volume allows traders to evaluate the strength and potential of market movements more effectively.
🔵 KEY FEATURES & USAGE
VIDYA Calculation:
The Variable Index Dynamic Average (VIDYA) is a special type of moving average that adjusts dynamically to the market’s volatility and momentum. Unlike traditional moving averages that use fixed periods, VIDYA adjusts its smoothing factor based on the relative strength of the price movements, using the Chande Momentum Oscillator (CMO) to capture the magnitude of price changes. When momentum is strong, VIDYA adapts and smooths out price movements quicker, making it more responsive to rapid price changes. This makes VIDYA more adaptable to volatile markets compared to traditional moving averages such as the Simple Moving Average (SMA) or the Exponential Moving Average (EMA), which are less flexible.
// VIDYA (Variable Index Dynamic Average) function
vidya_calc(src, vidya_length, vidya_momentum) =>
float momentum = ta.change(src)
float sum_pos_momentum = math.sum((momentum >= 0) ? momentum : 0.0, vidya_momentum)
float sum_neg_momentum = math.sum((momentum >= 0) ? 0.0 : -momentum, vidya_momentum)
float abs_cmo = math.abs(100 * (sum_pos_momentum - sum_neg_momentum) / (sum_pos_momentum + sum_neg_momentum))
float alpha = 2 / (vidya_length + 1)
var float vidya_value = 0.0
vidya_value := alpha * abs_cmo / 100 * src + (1 - alpha * abs_cmo / 100) * nz(vidya_value )
ta.sma(vidya_value, 15)
When momentum is strong, VIDYA adapts and smooths out price movements quicker, making it more responsive to rapid price changes. This makes VIDYA more adaptable to volatile markets compared to traditional moving averages
Triangle Trend Shift Signals:
The indicator marks trend shifts with up and down triangles, signaling a potential change in direction. These signals appear when the price crosses above a VIDYA during an uptrend or crosses below during a downtrend.
Volume Pressure Calculation:
The Volumatic VIDYA tracks the buy and sell pressure during each trend, calculating the cumulative volume for up and down bars. Positive delta volume occurs during uptrends due to higher buy pressure, while negative delta volume reflects higher sell pressure during downtrends. The delta is displayed in real-time on the chart, offering a quick view of volume imbalances.
Market Structure Pivot Lines with Volume Labels:
The indicator draws horizontal lines based on market structure pivots, which are calculated using the highs and lows of price action. These lines are extended on the chart until price crosses them. The indicator also plots the average volume over a 6-bar range to provide a clearer understanding of volume dynamics at critical points.
🔵 CUSTOMIZATION
VIDYA Length & Momentum: Control the sensitivity of the VIDYA line by adjusting the length and momentum settings, allowing traders to customize the smoothing effect to match their trading style.
Volume Pivot Detection: Set the number of bars to consider for identifying pivots, which influences the calculation of the average volume at key levels.
Band Distance: Adjust the band distance multiplier for controlling how far the upper and lower bands extend from the VIDYA line, based on the ATR (Average True Range).

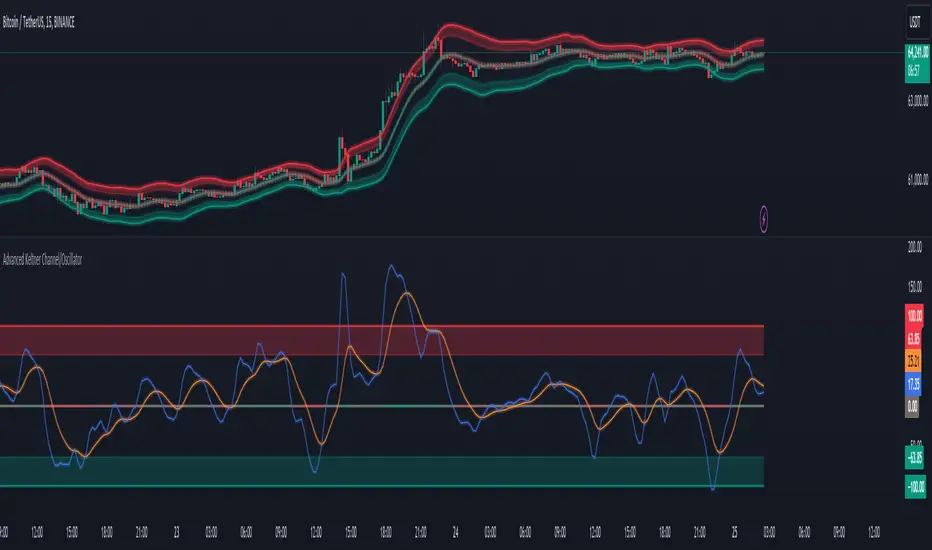
Advanced Keltner Channel/Oscillator [MyTradingCoder]This indicator combines a traditional Keltner Channel overlay with an oscillator, providing a comprehensive view of price action, trend, and momentum. The core of this indicator is its advanced ATR calculation, which uses statistical methods to provide a more robust measure of volatility.
Starting with the overlay component, the center line is created using a biquad low-pass filter applied to the chosen price source. This provides a smoother representation of price than a simple moving average. The upper and lower channel lines are then calculated using the statistically derived ATR, with an additional set of mid-lines between the center and outer lines. This creates a more nuanced view of price action within the channel.
The color coding of the center line provides an immediate visual cue of the current price momentum. As the price moves up relative to the ATR, the line shifts towards the bullish color, and vice versa for downward moves. This color gradient allows for quick assessment of the current market sentiment.
The oscillator component transforms the channel into a different perspective. It takes the price's position within the channel and maps it to either a normalized -100 to +100 scale or displays it in price units, depending on your settings. This oscillator essentially shows where the current price is in relation to the channel boundaries.
The oscillator includes two key lines: the main oscillator line and a signal line. The main line represents the current position within the channel, smoothed by an exponential moving average (EMA). The signal line is a further smoothed version of the oscillator line. The interaction between these two lines can provide trading signals, similar to how MACD is often used.
When the oscillator line crosses above the signal line, it might indicate bullish momentum, especially if this occurs in the lower half of the oscillator range. Conversely, the oscillator line crossing below the signal line could signal bearish momentum, particularly if it happens in the upper half of the range.
The oscillator's position relative to its own range is also informative. Values near the top of the range (close to 100 if normalized) suggest that price is near the upper Keltner Channel band, indicating potential overbought conditions. Values near the bottom of the range (close to -100 if normalized) suggest proximity to the lower band, potentially indicating oversold conditions.
One of the strengths of this indicator is how the overlay and oscillator work together. For example, if the price is touching the upper band on the overlay, you'd see the oscillator at or near its maximum value. This confluence of signals can provide stronger evidence of overbought conditions. Similarly, the oscillator hitting extremes can draw your attention to price action at the channel boundaries on the overlay.
The mid-lines on both the overlay and oscillator provide additional nuance. On the overlay, price action between the mid-line and outer line might suggest strong but not extreme momentum. On the oscillator, this would correspond to readings in the outer quartiles of the range.
The customizable visual settings allow you to adjust the indicator to your preferences. The glow effects and color coding can make it easier to quickly interpret the current market conditions at a glance.
Overlay Component:
The overlay displays Keltner Channel bands dynamically adapting to market conditions, providing clear visual cues for potential trend reversals, breakouts, and overbought/oversold zones.
The center line is a biquad low-pass filter applied to the chosen price source.
Upper and lower channel lines are calculated using a statistically derived ATR.
Includes mid-lines between the center and outer channel lines.
Color-coded based on price movement relative to the ATR.
Oscillator Component:
The oscillator component complements the overlay, highlighting momentum and potential turning points.
Normalized values make it easy to compare across different assets and timeframes.
Signal line crossovers generate potential buy/sell signals.
Advanced ATR Calculation:
Uses a unique method to compute ATR, incorporating concepts like root mean square (RMS) and z-score clamping.
Provides both an average and mode-based ATR value.
Customizable Visual Settings:
Adjustable colors for bullish and bearish moves, oscillator lines, and channel components.
Options for line width, transparency, and glow effects.
Ability to display overlay, oscillator, or both simultaneously.
Flexible Parameters:
Customizable inputs for channel width multiplier, ATR period, smoothing factors, and oscillator settings.
Adjustable Q factor for the biquad filter.
Key Advantages:
Advanced ATR Calculation: Utilizes a statistical method to generate ATR, ensuring greater responsiveness and accuracy in volatile markets.
Overlay and Oscillator: Provides a comprehensive view of price action, combining trend and momentum analysis.
Customizable: Adjust settings to fine-tune the indicator to your specific needs and trading style.
Visually Appealing: Clear and concise design for easy interpretation.
The ATR (Average True Range) in this indicator is derived using a sophisticated statistical method that differs from the traditional ATR calculation. It begins by calculating the True Range (TR) as the difference between the high and low of each bar. Instead of a simple moving average, it computes the Root Mean Square (RMS) of the TR over the specified period, giving more weight to larger price movements. The indicator then calculates a Z-score by dividing the TR by the RMS, which standardizes the TR relative to recent volatility. This Z-score is clamped to a maximum value (10 in this case) to prevent extreme outliers from skewing the results, and then rounded to a specified number of decimal places (2 in this script).
These rounded Z-scores are collected in an array, keeping track of how many times each value occurs. From this array, two key values are derived: the mode, which is the most frequently occurring Z-score, and the average, which is the weighted average of all Z-scores. These values are then scaled back to price units by multiplying by the RMS.
Now, let's examine how these values are used in the indicator. For the Keltner Channel lines, the mid lines (top and bottom) use the mode of the ATR, representing the most common volatility state. The max lines (top and bottom) use the average of the ATR, incorporating all volatility states, including less common but larger moves. By using the mode for the mid lines and the average for the max lines, the indicator provides a nuanced view of volatility. The mid lines represent the "typical" market state, while the max lines account for less frequent but significant price movements.
For the color coding of the center line, the mode of the ATR is used to normalize the price movement. The script calculates the difference between the current price and the price 'degree' bars ago (default is 2), and then divides this difference by the mode of the ATR. The resulting value is passed through an arctangent function and scaled to a 0-1 range. This scaled value is used to create a color gradient between the bearish and bullish colors.
Using the mode of the ATR for this color coding ensures that the color changes are based on the most typical volatility state of the market. This means that the color will change more quickly in low volatility environments and more slowly in high volatility environments, providing a consistent visual representation of price momentum relative to current market conditions.
Using a good IIR (Infinite Impulse Response) low-pass filter, such as the biquad filter implemented in this indicator, offers significant advantages over simpler moving averages like the EMA (Exponential Moving Average) or other basic moving averages.
At its core, an EMA is indeed a simple, single-pole IIR filter, but it has limitations in terms of its frequency response and phase delay characteristics. The biquad filter, on the other hand, is a two-pole, two-zero filter that provides superior control over the frequency response curve. This allows for a much sharper cutoff between the passband and stopband, meaning it can more effectively separate the signal (in this case, the underlying price trend) from the noise (short-term price fluctuations).
The improved frequency response of a well-designed biquad filter means it can achieve a better balance between smoothness and responsiveness. While an EMA might need a longer period to sufficiently smooth out price noise, potentially leading to more lag, a biquad filter can achieve similar or better smoothing with less lag. This is crucial in financial markets where timely information is vital for making trading decisions.
Moreover, the biquad filter allows for independent control of the cutoff frequency and the Q factor. The Q factor, in particular, is a powerful parameter that affects the filter's resonance at the cutoff frequency. By adjusting the Q factor, users can fine-tune the filter's behavior to suit different market conditions or trading styles. This level of control is simply not available with basic moving averages.
Another advantage of the biquad filter is its superior phase response. In the context of financial data, this translates to more consistent lag across different frequency components of the price action. This can lead to more reliable signals, especially when it comes to identifying trend changes or price reversals.
The computational efficiency of biquad filters is also worth noting. Despite their more complex mathematical foundation, biquad filters can be implemented very efficiently, often requiring only a few operations per sample. This makes them suitable for real-time applications and high-frequency trading scenarios.
Furthermore, the use of a more sophisticated filter like the biquad can help in reducing false signals. The improved noise rejection capabilities mean that minor price fluctuations are less likely to cause unnecessary crossovers or indicator movements, potentially leading to fewer false breakouts or reversal signals.
In the specific context of a Keltner Channel, using a biquad filter for the center line can provide a more stable and reliable basis for the entire indicator. It can help in better defining the overall trend, which is crucial since the Keltner Channel is often used for trend-following strategies. The smoother, yet more responsive center line can lead to more accurate channel boundaries, potentially improving the reliability of overbought/oversold signals and breakout indications.
In conclusion, this advanced Keltner Channel indicator represents a significant evolution in technical analysis tools, combining the power of traditional Keltner Channels with modern statistical methods and signal processing techniques. By integrating a sophisticated ATR calculation, a biquad low-pass filter, and a complementary oscillator component, this indicator offers traders a comprehensive and nuanced view of market dynamics.
The indicator's strength lies in its ability to adapt to varying market conditions, providing clear visual cues for trend identification, momentum assessment, and potential reversal points. The use of statistically derived ATR values for channel construction and the implementation of a biquad filter for the center line result in a more responsive and accurate representation of price action compared to traditional methods.
Furthermore, the dual nature of this indicator – functioning as both an overlay and an oscillator – allows traders to simultaneously analyze price trends and momentum from different perspectives. This multifaceted approach can lead to more informed decision-making and potentially more reliable trading signals.
The high degree of customization available in the indicator's settings enables traders to fine-tune its performance to suit their specific trading styles and market preferences. From adjustable visual elements to flexible parameter inputs, users can optimize the indicator for various trading scenarios and time frames.
Ultimately, while no indicator can predict market movements with certainty, this advanced Keltner Channel provides traders with a powerful tool for market analysis. By offering a more sophisticated approach to measuring volatility, trend, and momentum, it equips traders with valuable insights to navigate the complex world of financial markets. As with any trading tool, it should be used in conjunction with other forms of analysis and within a well-defined risk management framework to maximize its potential benefits.
God's of LiquidityHere’s a detailed description for your script, following the guidelines for clarity and originality:
---
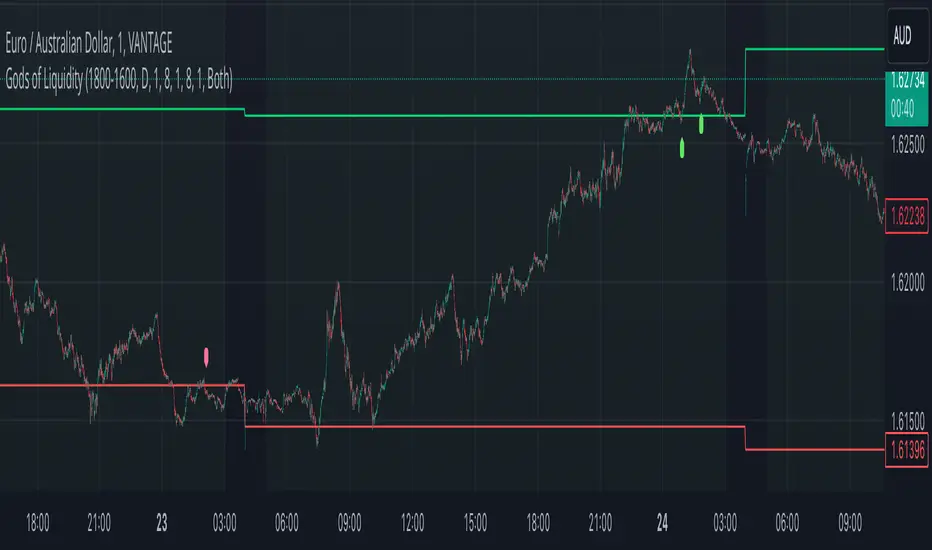
**Title:** God's of Liquidity
**Description:**
The "Gods of Liquidity" script is a comprehensive trading tool designed to help traders identify high-probability buy and sell opportunities based on a combination of liquidity levels, RSI-based sentiment analysis, and session-specific filters.
**Key Features:**
1. **Liquidity Zones Identification:**
- The script dynamically calculates the previous day's high and low levels, which serve as critical liquidity zones. Traders can use these levels to spot potential breakout points and reversals.
2. **RSI-Based Sentiment Analysis:**
- The script incorporates a sophisticated RSI-based sentiment model that differentiates between institutional (Banker) and retail (Hot Money) activity. This dual RSI approach allows traders to gauge market sentiment and anticipate shifts in momentum.
- **Banker RSI:** Measures the sentiment of institutional traders, with customizable sensitivity and period parameters.
- **Hot Money RSI:** Measures retail trader sentiment, with its own adjustable settings to tailor the script to various market conditions.
3. **Session and Day Filters:**
- Traders can restrict signals to specific trading sessions and days of the week, providing greater control and precision in executing trades. This feature is particularly useful for aligning trading activity with market conditions that best suit the strategy.
4. **Breakout and Reversal Signals:**
- The script generates buy signals when the price breaks above the previous day's high, accompanied by bullish RSI sentiment from institutional traders. Conversely, sell signals are generated when the price breaks below the previous day's low, with bearish institutional sentiment.
- These signals are visually marked on the chart, making it easier for traders to identify potential trading opportunities.
5. **Customizable Moving Averages:**
- The script allows users to customize the moving averages used in the RSI calculations, giving traders the flexibility to adapt the tool to their specific trading style and market conditions.
6. **Alert System:**
- Alerts are integrated to notify traders when buy or sell conditions are met, ensuring that traders can react promptly to potential trading opportunities without constantly monitoring the charts.
**How It Works:**
- The script uses the previous day's high and low as key liquidity levels. The price crossing these levels, combined with RSI-based signals, indicates potential buy or sell opportunities.
- The sentiment analysis is derived from the RSI values, with separate calculations for institutional and retail activities. The crossover points of these RSI values against their respective moving averages trigger buy or sell signals.
- The session and day filters allow traders to focus on the most relevant times for trading, enhancing the effectiveness of the strategy.
**Usage:**
- This indicator is designed for Forex traders who want to integrate liquidity zones and sentiment analysis into their trading strategy. It is particularly effective on daily or higher timeframes where liquidity levels and RSI-based sentiment analysis can provide strong indications of market direction.
- The script's flexibility in adjusting session times, days, and RSI parameters makes it suitable for a wide range of trading styles, from day trading to swing trading.
---
**License:**
This source code is subject to the terms of the Mozilla Public License 2.0 at (mozilla.org).
© bankbaguitarcrazy
---
This description should provide sufficient detail to comply with the publication guidelines, offering clear insight into how the script works and its unique features.
ChartArt-Bankniftybuying5minName: ChartArt-BankNifty Buying Strategy (5-Minute)
Timeframe: 5-Minute Candles
Asset: BankNifty (Indian Stock Market Index)
Trading Hours: 9:30 AM - 2:45 PM IST (Indian Standard Time)
This strategy is designed for BankNifty intraday traders who want to capitalize on short-term price movements within a defined trading window. It combines technical indicators like Simple Moving Averages (SMA), Relative Strength Index (RSI), and candlestick patterns to identify potential buy signals during intraday downtrends. The strategy employs specific entry, stop-loss, and target conditions to manage trades effectively and minimize risk.
Technical Indicators Used
Simple Moving Averages (SMA):
EMA7: 7-period SMA on closing price.
EMA5: 5-period SMA on closing price.
Purpose: Used to identify the intraday trend by comparing short-term moving averages. The strategy focuses on situations where the market is in a minor downtrend, indicated by EMA5 being below EMA7.
Relative Strength Index (RSI):
RSI14: 14-period RSI, a momentum oscillator that measures the speed and change of price movements.
SMA14: 14-period SMA of the RSI.
Purpose: RSI is used to identify potential reversal points. The strategy looks for situations where the RSI is below its own moving average, suggesting weakening momentum in the downtrend.
Candlestick Patterns:
Relaxed Hammer or Doji (2nd Candle): A pattern where the second candle in a 3-candle sequence shows a potential reversal signal (Hammer or Doji), indicating indecision or a potential turning point.
Bearish 1st Candle: The first candle is bearish, setting up the context for a potential reversal.
Bullish 3rd Candle: The third candle must be bullish with specific characteristics (closing near the high, surpassing the previous high), confirming the reversal.
Strategy Conditions
Time Condition:
The strategy is only active during specific hours (9:30 AM to 2:45 PM IST). This ensures that trades are only taken during the most liquid hours of the trading day, avoiding potential volatility or lack of liquidity towards market close.
Intraday Downtrend Condition:
EMA5 < EMA7: Indicates that the market is in a minor downtrend. The strategy looks for reversal opportunities within this trend.
RSI Condition:
RSI14 <= SMA14: Indicates that the current RSI value is below its 14-period SMA, suggesting potential weakening momentum, which can precede a reversal.
Candlestick Patterns:
1st Candle: Must be bearish, setting up the context for a potential reversal.
2nd Candle: Must either be a Hammer or Doji, indicating a potential reversal pattern.
3rd Candle: Must be bullish, with specific characteristics (closing near the high, breaking the previous high, etc.), confirming the reversal.
RSI Crossover Condition:
A crossover of the RSI over its SMA in the last 5 periods is also checked, adding further confirmation to the reversal signal.
Entry and Exit Rules
Entry Signal:
A buy signal is generated when all the conditions (time, intraday downtrend, bearish 1st candle, hammer/doji 2nd candle, bullish 3rd candle, and RSI condition) are met. The trade is entered at the high of the bullish third candle.
Stop Loss:
The stop loss is calculated based on the difference between the entry price and the low of the second candle. If this difference is greater than 90 points, the stop loss is placed at the midpoint of the second candle's range (average of high and low). Otherwise, it is placed at the low of the second candle.
Target 1:
The first target is set at 1.8 times the difference between the entry price and the stop loss. When this target is hit, half of the position is exited to lock in partial profits.
Target 2:
The second target is set at 3 times the difference between the entry price and the stop loss. The remaining position is exited at this point, or if the price hits the stop loss.
Originality and Usefulness
This strategy is original in its combination of multiple technical indicators and candlestick patterns to identify potential reversals in a specific intraday timeframe. By focusing on minor downtrends and utilizing a 3-candle reversal pattern, the strategy seeks to capture quick price movements with a structured approach to risk management.
Key Benefits:
High Precision: The strategy’s multi-step filtering process (time condition, trend confirmation, candlestick pattern analysis, and momentum evaluation via RSI) increases the likelihood of accurate trade signals.
Risk Management: The use of a dynamic stop-loss based on candle characteristics, combined with partial profit-taking, allows traders to lock in profits while still giving the trade room to develop further.
Structured Approach: The strategy provides a clear, rule-based system for entering and exiting trades, which can help remove emotional decision-making from the trading process.
Charts and Signals
The strategy produces signals in the form of labels on the chart:
Buy Signal: A green label is plotted below the candle that meets all entry conditions, indicating a potential buy opportunity.
Stop Loss (SL): A red dashed line is drawn at the stop-loss level with a label indicating "SL".
Target 1 (1st TG): A blue dashed line is drawn at the first target level with a label indicating "1st TG".
Target 2 (2nd TG): Another blue dashed line is drawn at the second target level with a label indicating "2nd TG".
These visual aids help traders quickly identify entry points, stop loss levels, and target levels on the chart, making the strategy easy to follow and implement.
Backtesting and Optimization
Backtesting: The strategy can be backtested on TradingView using historical data to evaluate its performance. Traders should consider testing across different market conditions to ensure the strategy's robustness.
Optimization: Parameters such as the RSI period, moving averages, and target multipliers can be optimized based on backtesting results to refine the strategy further.
Conclusion
The ChartArt-BankNifty Buying Strategy offers a well-rounded approach to intraday trading, focusing on capturing reversals in minor downtrends. With a strong emphasis on technical analysis, precise entry and exit rules, and robust risk management, this strategy provides a solid framework for traders looking to engage in intraday trading on BankNifty.

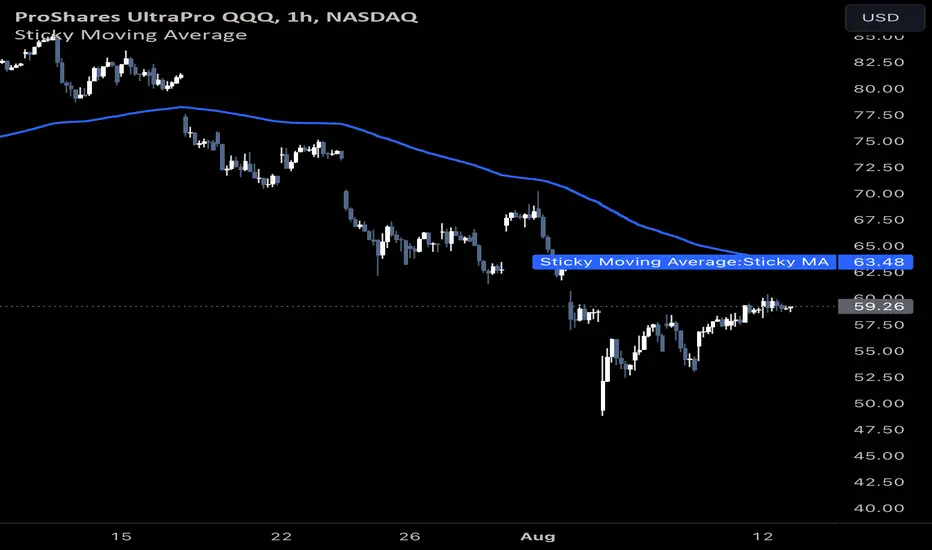
Sticky Moving AverageThe Sticky Moving Average is a custom indicator designed to provide a unique smoothing effect by combining different moving averages derived from a single base period. This indicator creates a single line on the chart, representing the average of the following three moving averages:
1. X-period Simple Moving Average (SMA): A traditional moving average that smooths the price data over the full period.
2. X/2-period Simple Moving Average (SMA): A faster-moving average that smooths the price data over half of the base period.
3. X/4-period Exponential Moving Average (EMA): An exponential moving average that gives more weight to recent prices, calculated over one-fourth of the base period.
The result is a moving average that "sticks" to price action by considering both short-term and long-term trends, offering a balanced view of market momentum.
This indicator is ideal for traders looking to gain a nuanced understanding of price movements by incorporating multiple smoothing periods into a single, easy-to-use line. Adjust the `X` value to suit your trading strategy and enjoy the clarity this composite moving average can bring to your charts.
US M2### Relevance and Functionality of the "US M2" Indicator
#### Relevance
The "US M2" indicator is relevant for several reasons:
1. **Macro-Economic Insight**: The M2 money supply is a critical indicator of the amount of liquidity in the economy. Changes in M2 can significantly impact financial markets, including equities, commodities, and cryptocurrencies.
2. **Trend Identification**: By analyzing the M2 money supply with moving averages, the indicator helps identify long-term and short-term trends, providing insights into economic conditions and potential market movements.
3. **Trading Signals**: The indicator generates bullish and bearish signals based on moving average crossovers and the difference between current M2 values and their moving averages. These signals can be useful for making informed trading decisions.
#### How It Works
1. **Data Input**:
- **US M2 Money Supply**: The indicator fetches the US M2 money supply data using the "USM2" symbol with a monthly resolution.
2. **Moving Averages**:
- **50-Period SMA**: Calculates the Simple Moving Average (SMA) over 50 periods (months) to capture short-term trends.
- **200-Period SMA**: Calculates the SMA over 200 periods to identify long-term trends.
3. **Difference Calculation**:
- **USM2 Difference**: Computes the difference between the current M2 value and its 50-period SMA to highlight deviations from the short-term trend.
4. **Amplification**:
- **Amplified Difference**: Multiplies the difference by 100 to make the deviations more visible on the chart.
5. **Bullish and Bearish Conditions**:
- **Bullish Condition**: When the current M2 value is above the 50-period SMA, indicating a positive short-term trend.
- **Bearish Condition**: When the current M2 value is below the 50-period SMA, indicating a negative short-term trend.
6. **Short-Term SMA of Amplified Difference**:
- **14-Period SMA**: Applies a 14-period SMA to the amplified difference to smooth out short-term fluctuations and provide a clearer trend signal.
7. **Plots and Visualizations**:
- **USM2 Plot**: Plots the US M2 data for reference.
- **200-Period SMA Plot**: Plots the long-term SMA to show the broader trend.
- **Amplified Difference Histogram**: Plots the amplified difference as a histogram with green bars for bullish conditions and red bars for bearish conditions.
- **SMA of Amplified Difference**: Plots the 14-period SMA of the amplified difference to track the trend of deviations.
8. **Moving Average Cross Signals**:
- **Bullish Cross**: Plots an upward triangle when the 50-period SMA crosses above the 200-period SMA, signaling a potential long-term uptrend.
- **Bearish Cross**: Plots a downward triangle when the 50-period SMA crosses below the 200-period SMA, signaling a potential long-term downtrend.
### Summary
The "US M2" indicator provides a comprehensive view of the US M2 money supply, highlighting significant trends and deviations. By combining short-term and long-term moving averages with amplified difference analysis, it offers valuable insights and trading signals based on macroeconomic liquidity conditions.

Six T3 Bands – Set to Any Time Frame [1000X]Script Description: Six T3 Bands – Set to Any Time Frame
This script leverages T3 lines, an advanced form of moving averages, to provide more adaptive and responsive indicators compared to traditional Moving Averages (MA) or Exponential Moving Averages (EMA). The T3 indicator, originally conceptualized by Tim Tillson in 1998, is known for its smoothness and reduced lag, making it a powerful tool for traders seeking precise market signals.
Features:
1 Adjustable Parameters:
◦ The script allows for the customization of six different T3 lines, each with adjustable lengths and "b values" (smoothing coefficients). This flexibility lets users fine-tune the indicators to fit various trading styles and market conditions.
◦ Users can set the reference timeframe for the T3 lines using the request.security function, enabling analysis across different timeframes. By default, the timeframe is set to the daily chart.
2 Calculation Method:
◦ The T3 lines are calculated using a multi-stage Exponential Moving Average (EMA) process. Specifically, the price data is smoothed through six stages of EMA calculations, with coefficients applied to produce the final T3 value. This method ensures the T3 lines are smoother and less laggy than traditional moving averages.
3 Usage:
◦ The T3 lines can be utilized to identify natural support and resistance levels within the market. By observing how the price interacts with these lines, traders can gain insights into potential reversal points or continuation patterns.
◦ The script's default settings are optimized for identifying these levels, but users are encouraged to adjust the parameters to match their specific trading strategies.
How to Use:
1 Customization:
◦ Access the script's settings to adjust the T3 lengths and "b values" for each of the six lines. This customization allows you to tailor the indicator to your preferred sensitivity and responsiveness.
◦ Set the reference timeframe according to your analysis needs. Whether you prefer intraday, daily, or longer-term charts, the T3 lines will remain set to the reference timeframe that you choose, while you focus your attention on the time frame of your choice.
2 Trading Strategies:
◦ Support and Resistance Trading: Use the T3 lines to identify key support and resistance zones. Look for price reactions around these lines to make informed trading decisions.
◦ Trend Confirmation: Combine the T3 lines with other technical indicators to confirm trends and filter out noise. The smoothness of the T3 lines helps in recognizing genuine trend changes.
Conclusion: This script builds on the foundational work of Tim Tillson and the classic T3 Average script by @HPotter (2014). Significant enhancements include making the "b value" an adjustable input and utilizing the request.security function to apply T3 lines to a specified timeframe. These improvements provide traders with greater control and adaptability, enhancing the practical utility of the T3 indicator.
The "Six T3 Bands – Set to Any Time Frame " script offers a useful tool for traders looking to enhance their technical analysis, both to visualize trend direction and to identify likely support and resistance levels. Its adaptive nature and customizable features make it a valuable addition to many trading strategies..

Adaptive Moving Average (AMA)The Adaptive Moving Average (AMA), also known as Kaufman's Adaptive Moving Average (KAMA), is a trend-following indicator that adapts to market volatility. It was developed by Perry Kaufman in 1972 to improve upon traditional moving averages by making the smoothing period dynamic based on market conditions.
The AMA aims to:
- Smooth out price data to reduce noise, similar to other moving averages.
- Adapt its smoothing based on market volatility and trend strength.
Here's how the Adaptive Moving Average (AMA) works:
1. Calculate the Efficiency Ratio (ER): The AMA begins by calculating the Efficiency Ratio (ER), which measures the efficiency of a price trend. It's calculated as the absolute change in closing prices over a period (`PeriodEfficiencyRatio`) divided by the sum of absolute changes in closing prices over the same period. The ER value ranges from 0 to 1, with higher values indicating a stronger trend.
2. Determine the Smoothing Constant (sc): Using the ER, the AMA calculates the smoothing constant (sc). This constant ranges between a predefined slow EMA (exponential moving average) and fast EMA, depending on the ER.
3. Compute the AMA value: The AMA is then calculated using the smoothing constant (sc) and the previous AMA value, as well as the current close price. This allows the AMA to adapt its smoothing based on the market's volatility.
4. Plot the AMA: The AMA is plotted on the chart, usually as a line, which follows the price action more closely in periods of strong trends and provides more smoothing in periods of lower volatility.
Usage and Interpretation:
- The Adaptive Moving Average can be used to identify trends and potential entry and exit points.
- When the price is above the AMA line, it may indicate an uptrend, and when the price is below the AMA line, it may indicate a downtrend.
- Crossovers of the price with the AMA line can signal potential buy or sell opportunities.
- The adaptability of the AMA makes it more responsive in trending markets and smoother in range-bound markets, providing an advantage over traditional moving averages.
Parameters:
- Period for EfficiencyRatio calculation (`PeriodEfficiencyRatio`):** The period over which the Efficiency Ratio is calculated.
- Fast EMA Length (`fastLength`) and Slow EMA Length (`slowLength`):** These parameters define the range for the smoothing constant. A shorter fast length makes the AMA more responsive, while a longer slow length makes it smoother.
The AMA can be a useful tool in a trader's toolkit for analyzing market trends and making informed trading decisions. Adjusting the parameters can fine-tune the AMA for different trading styles and market conditions.

MoonFlag BTC Daily Swing PredictorThis script mainly works on BTC on the daily timeframe. Other coins also show similar usefulness with this script however, BTC on the daily timeframe is the main design for this script.
(Please note this is not trading advice this is just comments about how this indicator works.)
This script is predictive. It colors the background yellow when the script calculates a large BTC swing is potentially about to happen. It does not predict in which direction the swing will occur but it leads the price action so can be useful for leveraged trades. When the background gets colored with vertical yellow lines - this shows that a largish price swing is probably going to occur.
The scripts also shades bands around the price action that are used to estimate an acceptable volatility at any given time. If the bands are wide that means price action is volatile and large swings are not easily predicted. Over time, with reducing volatility, these price action bands narrow and then at a set point or percentage (%) which can be set in the script settings, the background gets colored yellow. This indicates present price action is not volatile and a large price swing is potentially going to happen in the near future. When price action breaks through the narrowing bands, the background is no longer presented because this is seen as an increase in volatility and a considerable portion of the time, a large sudden drop in price action or momentous gain in price is realized.
This indicator leads price action. It predicts that a swing is possibly going to happen in the near future. As the indicator works on the BTC daily, this means on a day-to-day basis if the bands continually narrow - a breakout is more likely to happen. In order to see how well this indicator works, have a look at the results on the screenshot provided. Note the regions where vertical yellow lines are present on the price action - and then look after these to see if a sizeable swing in price has occurred.
To use this indicator - wait until yellow vertical lines are presented on the BTC daily. Then use your experience to determine which way the price action might swing and consider entering a trade or leveraged trade in this direction. Alternatively wait a while to see in which direction the break-out occurs and considering and attempt to trade with this. Sometimes swings can be unexpected and breakout in one direction before then swinging much larger in the other. Its important to remember/consider that this indicator works on the BTC daily timeframe, so any consideration of entering a trade should be expected to cover a duration over many days or weeks, or possibly months. A large swing is only estimated every several plus months.
Most indicators are based on moving averages. A moving average is not predictive in the sense in that it lags price actions. This indicator creates bands that are based on the momentum of the price action. A change in momentum of price action therefore causes the bands to widen. When the bands narrow this means that the momentum of the price action is steady and price action volatility has converged/reduced over time. With BTC this generally means that a large swing in price action is going to occur as momentum in price action then pick-up again in one direction or another. Trying to view this using moving averages is not easy as a moving average lags price action which means that it is difficult to predict any sudden movements in price action ahead of when they might occur. Although, moving averages will converge over time in a similar manner as the bands calculated by this script. This script however, uses the price action momentum in a predictive manner to estimate where the price action might go based on present price momentum. This script therefore reacts to reduced volatility in price action much faster than a set of moving averages over various timescales can achieve.
MoonFlag

MA+ ProjectionThe "MA+ Projection" indicator is designed to visualize the potential future direction of a moving average, taking into account the impact of historical data loss. It is primarily aimed at providing a practical perspective on how moving averages could evolve as older data points are no longer considered.
Key Features:
Supported Moving Averages: SMA, EMA, WMA, VWMA, and VAWMA (Volume Adjusted WMA).
Flexible Time Span Settings: Customize the moving average length in bars, minutes, or days.
Adjustable Projection Scope: Set a percentage of the measurement to project forward.
Projection 'Cone': Show/hide the deviation and control the multiple.
Use Last Source Value: An option to add the latest known value to the moving window instead of only letting the window shrink. (Enabled by default.)
How It Works:
Given the specified parameters, it takes the selected moving average type (a known formula like SMA, EMA, or WMA), and projects the future data points by continuing to move the data 'window' forward without adding any more data. By default, it extends the average by assuming the price hasn't changed after the last bar. Alternatively, the projection can be the result of shrinking the window as it moves forward without adding any new data points.
Note:
This tool is for visual projection, not prediction. Its purpose is to aid in the analysis of potential future trends based on historical data, not to provide definitive market forecasts.

Trend FinderThe "𝙏𝙍𝙀𝙉𝘿 𝙁𝙄𝙉𝘿𝙀𝙍" indicator is a powerful tool designed to detect trends and identify potential reversal points in asset prices. It operates as both a trend-following and mean reversion indicator, offering insights into market movements.
Trend Identification:
Trend Detection:
This indicator primarily identifies trends in asset prices.
When the "𝙏𝙍𝙀𝙉𝘿 𝙁𝙄𝙉𝘿𝙀𝙍" value is above the middle line, it typically indicates an upward trend in the asset's price.
Color Coding: During an upward trend, the bars are colored green, signaling strength in the upward movement. Conversely, during a downtrend, the bars turn red, indicating a potential downward movement in the asset's price.
Calculation Process:
Moving Averages: The calculation involves using multiple Simple Moving Averages (SMAs) based on the open and close prices of the asset.
Incremental SMA Lengths: These SMAs are calculated with increasing lengths, creating a series of comparisons between closing and opening SMAs. If the closing SMA exceeds the opening SMA, a value of 1 is assigned; otherwise, it's assigned as 0.
Aggregation: All these SMA values are compiled into an array and processed to derive an average, emphasizing the trend direction and strength.
Application:
Trend Strength: The indicator's value reflects the overall strength and direction of the trend. Higher values suggest an end or reversing of trend, while lower values what crosses over or under Midline may indicate a trend changing and indicate incrising of trend strength.
Reversal Indication: Besides identifying trends, it can also serve as a mean reversion indicator, potentially pinpointing potential tops and bottoms in the market.
Midline: Additional in settings can be changed a position of midline to up or down to your personal preference.
The "𝙏𝙍𝙀𝙉𝘿 𝙁𝙄𝙉𝘿𝙀𝙍" indicator amalgamates moving averages and trend analysis, offering a comprehensive view of market trends and potential reversal points. Its adaptability through parameter adjustments allows for fine-tuning to suit various market conditions.

Price Strength Index + RSI Buy/Sell ZonesThe Price Strength Index + RSI Buy/Sell Zones indicator is a technical analysis tool designed to evaluate the strength of a financial asset's price movement by comparing it with a series of Volume Weighted Moving Averages (VWMAs) of different lengths calculated from historical data.
Hypothesis :
The core hypothesis behind this indicator is that assessing the relationship between the current price and a range of VWMAs with varying lengths can provide valuable insights into the strength and direction of a price trend. Additionally, it incorporates Relative Strength Index (RSI) conditions to further refine potential buy and sell signals.
How It Works :
Multiple VWMA Calculation: The indicator calculates multiple VWMAs, each with a different length, using historical price data and volume. These VWMAs represent weighted moving averages over various periods, helping to capture different aspects of the price trend.
Comparison with Current Price : For each of these VWMAs, the indicator compares the current bar's price with the VWMA value. This comparison is crucial in understanding how the current price relates to historical averages, shedding light on the strength and direction of the prevailing trend.
SMA of Percentage Above VWMA : The indicator calculates the Simple Moving Average (SMA) of the percentage of prices above the various VWMAs over a specified period. This moving average smoothens out the percentage data, providing a clearer trend signal.
Buy and Sell Zones : User-defined upper and lower thresholds for the percentage of prices above the VWMAs are used to define buy and sell zones. When the percentage falls below the lower threshold, it signals a potential buy zone, suggesting a weakening trend. Conversely, when it exceeds the upper threshold, it signifies a potential sell zone, indicating a strengthening trend.
RSI Integration : The RSI is calculated for the selected price source with a specified length. When the SMA of the percentage above VWMAs falls within the buy zone and the RSI is below the lower RSI threshold, it indicates an oversold condition, potentially signaling a buy opportunity. Conversely, when the SMA falls within the sell zone and the RSI is above the upper RSI threshold, it suggests an overbought condition, possibly signaling a sell opportunity.
Color Coding : The indicator employs color-coding to visually represent the buy and sell zones, as well as extreme RSI conditions. Green color denotes the buy zone, red represents the sell zone, and orange lines indicate the median and potential reversal points.
In summary, the Price Strength Index + RSI Buy/Sell Zones indicator leverages multiple VWMAs of different lengths to assess the relationship between current prices and historical moving averages. This comprehensive analysis, coupled with RSI conditions, aids traders in identifying potential buy and sell zones, as well as extreme RSI points within those zones, enhancing the evaluation of price strength and potential trend reversals.

MA Directional Table"MA Directional Table" primary objective is to analyze the direction of the trend based on two Moving Averages (MA) for various timeframes and customizing the inputs to match your preferred style.
Features:
Moving Average Type: You can select which type of Moving Average to use (SMA, EMA, VWMA).
Moving Average Lengths: You can set the lengths for the short-term and long-term moving averages.
Table Position: The indicator provides a table which can be placed at the top or bottom, and to the left or right of the chart. It shows the trend status for multiple timeframes (1 min, 5 min, 15 min, 1 hour, 4 hours, 1 day).
Table Orientation: The table can be oriented either horizontally or vertically.
Price Condition: Optionally, the table color can be set to yellow if the current price deviates from the Moving Average trend and crosses MA1.
Cloud Settings: You can opt to show a cloud between the two moving averages. The color of the cloud changes based on the direction of the trend (bullish or bearish).
Extra MA: Optionally, an extra Moving Average can be plotted on the chart.
